

How to Code a Sierra Chart Study with Claude Code (Without Writing C++)
Claude Code writes an opening range breakout study in Sierra Chart from scratch, compiles it to a DLL, and puts it on an ES and NQ chart — no C++ written by hand. The prompt anatomy, the exact inputs, the compile path, and the validation step that comes after: proving your Sierra signals match your Python backtest.
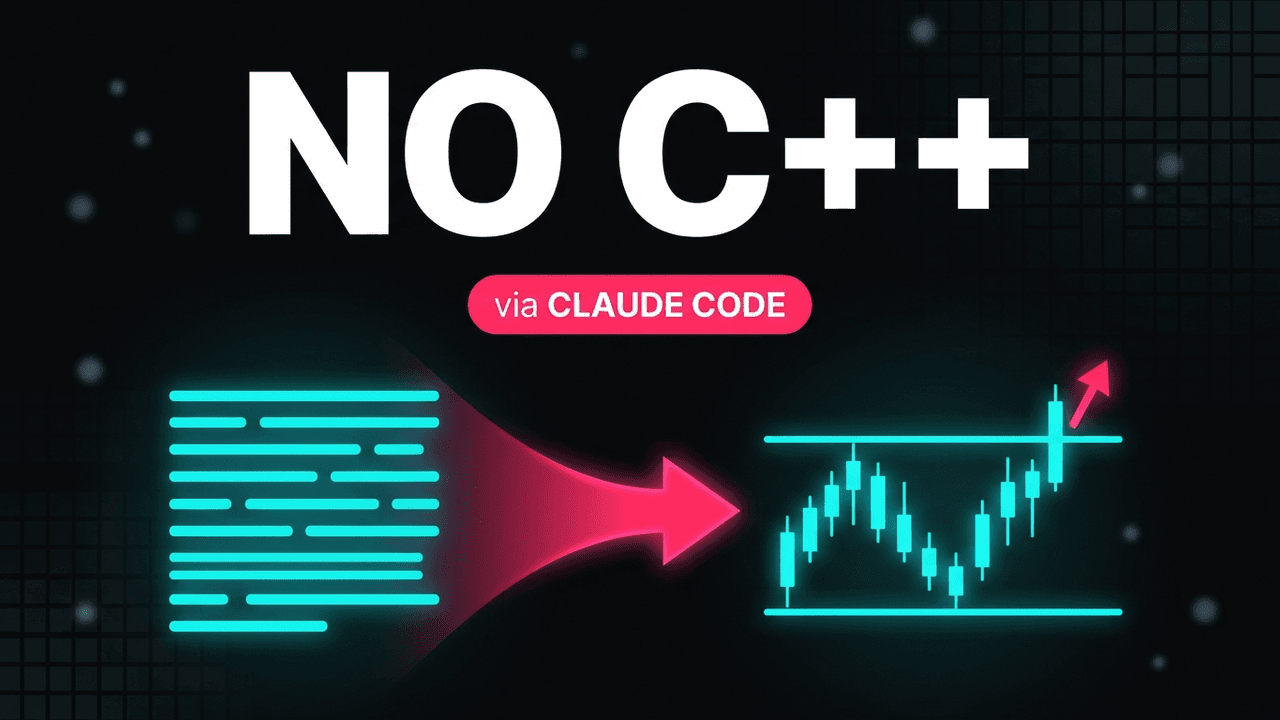
Published August 2026: Claude Code writes an opening range breakout study in Sierra Chart from scratch, compiles it to a DLL, and puts it on an ES and NQ chart. I don't write the C++. This is the written companion to the video above — the prompt anatomy, the exact inputs, the compile path, and the validation step that comes after.
Search YouTube for how to build a trading strategy in Sierra Chart with Claude Code and you get almost nothing. Plenty of "I connected AI to TradingView." Almost nobody points a coding agent at the platform futures traders actually route live orders through.
There's a reason, and it isn't that it doesn't work. It's that Sierra Chart's scripting layer is ACSIL — the Advanced Custom Study Interface and Language — and ACSIL is real C++ that compiles to a DLL and loads inside the platform. It's the steepest wall in retail trading software. It's also exactly the kind of wall an agent is good at taking down, once you stop asking it to guess.
I'm not going to pretend this is the hard part of trading. It isn't. So before the build, here's the map it sits inside.
The six stages, and the one everybody skips
Everything I run goes through the same six stages. The video walks all six; the build is stage 3.
| Stage | What happens | Who does it |
|---|---|---|
| 1 · Find the edge | Watch the market until a repeatable pattern shows up. Write down the exact sequence and the timestamp | You. Not the model |
| 2 · Backtest in Python | Read the raw .scid tick file off your own disk, reconstruct the idea tick by tick | Claude Code writes the harness |
| 3 · Code the signals | Turn the rules into an ACSIL study that draws and marks entries on the chart | Claude Code writes the C++ |
| 4 · Backtest the Sierra signals | Export what Sierra actually produced and compare it to the Python backtest | ⚡ The step almost nobody does |
| 5 · Wire the order management | A separate study that acts on the signals — adds, exits, kills the trade | Claude Code, carefully |
| 6 · Maintenance | Fix the bugs, find the biases you missed, loop | Forever |
Stage 1 is worth saying out loud because it's the part being sold hardest and it's the part that isn't real. AI is great at implementing your idea so you can test it. It is very poor at finding you an edge. I found mine by watching the market live for years until I could name a repeatable pattern and build a trade book out of it. No model shortened that. If someone is telling you otherwise, notice what they're selling.
What AI actually removed is the language barrier between "I can describe this" and "it's running on a chart." That's not nothing — that barrier is why most traders with a real idea never test it properly.
Why a cold prompt produces confident garbage
Ask any model to write you a Sierra Chart study with no context and you get hallucinated sc. calls, function signatures that don't exist, and the right shape of an ACSIL study wrapped around SDK details that are subtly wrong.
That's not the model being bad at C++. It's excellent at C++. ACSIL is just niche: there's far less of it in the world than Python or Pine, the authoritative material is scattered across reference pages and years of forum threads, and there's no clean, LLM-ready corpus of it anywhere. So it pattern-matches from thin data and fills the gaps with invention.
This is where most people conclude "AI can't do Sierra Chart" and quit, one step early.
The fix ships with the platform. Sierra Chart installs a folder of example studies — ACS_Source — full of correct, working ACSIL. Point Claude Code at that folder and it stops guessing. Models are dramatically better at "build another one like these" than at "invent one from scratch."
That single reference is the difference between garbage and a study that compiles.
The prompt, part by part
The prompt in the video is long, and it's long for a reason — the precision is the actual work now. The C++ isn't. Here's what's in it:
- A pointer at
ACS_Source. The shipped examples, named explicitly, as the structural baseline. - The rule, defined by time. Market open time, opening range length in minutes, session end time. Not "the opening range" — a definition with clocks in it.
- Every parameter as an input. Everything I'd want to change later gets exposed as a Sierra Chart input rather than hard-coded, so I can turn the knobs on the chart instead of recompiling.
- The subgraphs. Subgraphs are what you actually see plotted — the range rails, the midline, the signal arrows, the stop and target.
- Persistence. The study has to carry its state forward, because stage 5 needs something to execute against.
- Restate the rule and list your ambiguities before writing code.
That last one is the highest-value line in the prompt and it costs nothing.
The assumptions list is the point
Claude came back with the rule restated, and then a list of ambiguities it had resolved on my behalf.
That list is the most useful output of the entire build, and it's the part you're most tempted to skip. Every assumption in it is a place a bias can enter your backtest. Does a touch of the rail count, or does the bar have to close beyond it? Does the range include the opening print? What happens to a signal that fires in the last two minutes of the session?
Nobody prompts all of that in advance. You resolve it by reading the list.
Two more flags came back after the deploy: a documented deviation from one of my rules, and a "chart starts mid-session" warning. Both real, both worth checking, neither one obvious from looking at the chart. On camera I said it plainly and it's the line I'd keep from the whole video: you don't want to just blindly test and believe it one-shot it.
From prompt to a study on the chart
The build itself is short. It's the boring part, which is the point:
- Deploy. A second prompt copies the
.cppinto the Sierra Chart source folder. - Compile.
Analysis → Build Custom Studies DLL, select the study, Build. Sierra's own compiler turns the C++ into a DLL. - Read the build log. Not optional. It's the only place a compile failure tells you the truth.
- Add it.
Analysis → Studies → Add Custom Study, and every input from the prompt is sitting there as a field.
Five minutes earlier it was a paragraph of English. Now it's compiled C++ running natively inside the platform with no scripting sandbox — which is the reason to be on Sierra in the first place. It runs at tape speed.
The inputs I set, and why
These are the demo values from the video, on a generic ORB. Nothing here is an edge — it's the wiring.
| Input | Value | Why |
|---|---|---|
| Market open | 06:30 | I'm on the West Coast. Set this to your own session, not mine |
| Opening range | 30 min | Later changed to 15 on camera, to show the plot and signal redraw live |
| Session end | 13:00 | Flat by the cash close |
| Confirmation closes | 5 | Closes required beyond the rail before a signal fires |
| Risk | 50 pts or the opening range width | Two modes. The range-width mode makes risk adapt to the day |
| Target multiplier | 2.0 | 50 risked to make 100. Dropped to 1.5 on camera to watch the target move |
| Signal logging | on | Log every signal to the Message Log |
Two of those deserve more than a row.
Confirmation closes is a backtest output, not a preference. I set it to five because it's a demo. In a real build that number comes out of stage 2 — you don't pick it because it looks right on a chart.
Turn on signal logging every time. It costs one input and it's the difference between "the study did something weird on Tuesday" and a timestamped list you can go read. You will need it.
Stage 4: where the study and the backtest disagree
Here's the step I don't see anyone else doing, and it's the one that separates a study that compiles from a strategy you can trust.
Sierra Chart will export the raw output of your indicator alongside the raw tick data. So I built a backtest engine that takes the actual signals Sierra produced and compares them against my Python backtest.
Same tick data. Same rules. They didn't agree.
Not in a subtle, rounding-error way. There were real differences, and the causes were unglamorous:
- Contract roll dates. Where one side rolls to the next contract and the other doesn't, and the prices stop being the same series.
- Session hours. The backtest running a different definition of the trading day than the chart is.
- Small wiring differences between two implementations of what I'd have sworn was one rule.
None of those show up as an error. Both sides run clean, print plausible results, and quietly describe two different strategies. Going from backtest → signal → backtesting the signal against the platform's actual output gets you further than about 99% of people trying this.
If you only take one thing from the video, take that stage — not the ORB.
Two languages, two jobs
Which is a good frame for the whole stack:
.scidis the data spine. The raw tick file, on your disk, natively — the reason any of this is checkable.- Python is research. It reads the ticks and asks questions. It never touches an order.
- C++ / ACSIL is acting. It runs inside the platform at tape speed and marks the signal.
Two languages, two jobs. Most of the confusion in this niche comes from people trying to do both jobs in one place, on a platform that guesses what happened inside each bar.
Execution is a separate study — and it's where the edge lives
Stage 5 is the one I'd argue about with most people. I don't put execution in the signal study. It's a separate one.
My edge is never in the signal alone. A lot of it lives in how orders are managed after entry — adding to a trade that's working, cutting one that isn't, based on other studies entirely. The plain example: if you're trading an opening range breakout and you lean on VWAP as confirmation, then losing VWAP is an exit, regardless of what the breakout signal thinks.
The honest downside: order management is also where a whole new class of bugs comes from. Which is stage 6, and stage 6 doesn't end.
Where the agent drives, and where it doesn't
Worth stating plainly, because the platform is wired to a brokerage.
- Claude drafts. You compile. The agent loop ends at "write the code."
- Everything in the video runs in replay or sim. Live routing takes a deliberate configuration change, by you, and what it does after that is on you.
- Nothing with credentials or order routing goes through the agent. No broker config, no keys pasted on camera.
- Parity-test the output before you trust it. That's stage 4, and it's not optional just because the chart looks right.
None of that costs you speed. It keeps the non-deterministic thing on the drafting side of the line and the compiled thing, the one connected to money, on yours.
This is not an edge
The ORB built in the video is deliberately basic. There's probably nothing in it until you put it in line with other confluence and test it properly. I built it because it's the cleanest thing to watch get built, not because you should trade it.
The pipeline is the deliverable. The strategy is the demo.
What actually changed is that the C++ wall is gone. The thing standing between you and a tested idea is no longer whether you can write scsf_ functions. It's whether you can define your rule precisely enough to survive an assumptions list, and whether you'll do stage 4 when the chart already looks fine.
The prompt, the ORB study code, and the chartbook from this build are free — grab them here and they land in your inbox. Everything I teach is free: the method and the code in the repo. The paid layer is the assembled desk — the execution engine, the validated backtest kernel, the working files — never the methodology. I don't sell signals and I don't post live P&L. New to the desk? Start with why the pros backtest on Sierra Chart, not TradingView, or read what happens when five popular strategies meet honest fills.