

Sierra Chart + Claude Code: The Backtest Pipeline TradingView Can't Run
Why serious futures traders backtest on Sierra Chart's raw SCID tick data instead of TradingView's OHLC summaries: honest fills, the same-bar stop/target problem, and how Claude Code writes the tick-data reader that makes the whole pipeline accessible to one person.
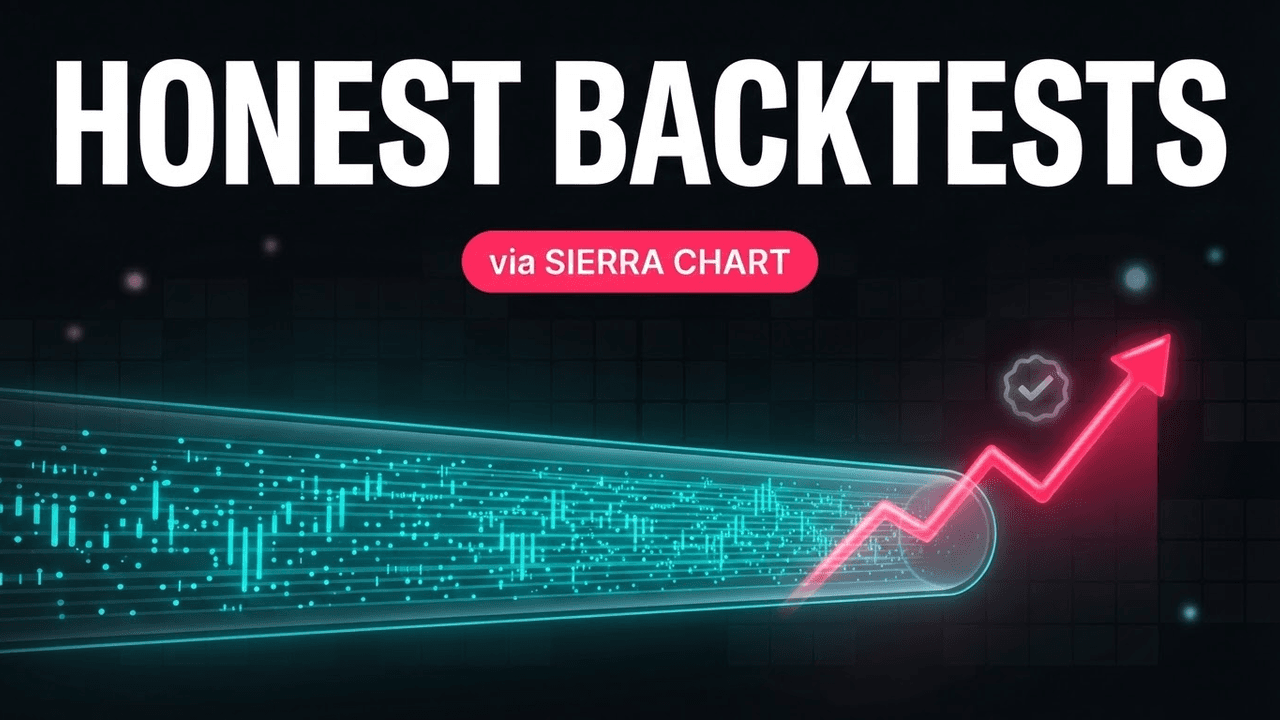
Published July 2026: why serious traders backtest on Sierra Chart instead of TradingView, what the raw SCID tick data actually unlocks, and how Claude Code makes the whole pipeline accessible to one person. This is the written companion to the video above.
Everyone is racing to build trading systems with AI. Point Claude at a chart, get a strategy in one prompt, watch the equity curve climb. It makes for a great screenshot. But almost nobody is asking the only question that actually matters: can you trust what you built?
Because a backtest that looks amazing and a backtest you can actually trade are two completely different things, and one platform can tell them apart. The other can't.
TradingView is where you learn. It's fast, it's approachable, and it's a fine place to answer "is this idea worth another hour of my time?" But it was never built to tell you the truth about a strategy. Sierra Chart was, because it starts from honest data. This is the platform serious futures traders and prop desks actually run on, almost nobody points AI at it, and Claude Code just made the whole thing accessible to a single operator.
Here's the pipeline the pros use, what each stage does, and why it's a thousand times more powerful for backtest development than what most people are building on.
Why a TradingView backtest can't be trusted
None of this is a knock on TradingView for what it's for. It's a knock on using it as proof.
- It guesses your fills. On a standard backtest, TradingView assumes how price moved inside each bar to fill your orders. That assumption is usually optimistic. Your real fills are worse, and the gap is invisible in the report.
- The data is thin. Depending on your plan, you get a limited number of bars. A few hundred trades on two years of one symbol is not a sample you can lean on.
- It's easy to cheat by accident. Higher-timeframe requests make lookahead and repainting easy to introduce and hard to notice. A lot of "amazing" published strategies are just reading the future.
- There's no verification layer. Nothing proves that the signals you'd trade live actually match the ones the backtest counted. That's the exact place edges quietly disappear.
You can absolutely build a beautiful curve on TradingView. You just can't prove it's real. And unprovable is the same as untrue once your own money is on the line.
The foundation: SCID tick data and a reader
Everything trustworthy starts with the data, and this is the thing most traders never touch.
Sierra Chart stores raw market data in SCID files: tick-by-tick, on your own disk. That's the difference between a photograph of the market and the market itself. The catch has always been getting at it programmatically. That's exactly the kind of job Claude Code is good at: point it at the format and have it build you an SCID reader.
Once you have that reader, the game changes:
Once you have an SCID reader, you can reconstruct any strategy tick by tick (accurate entries and exits), catch the biases, get years of data, and go much deeper than TradingView ever lets you.
You're no longer trusting a platform's guess about what happened inside a bar. You're replaying what actually happened, tick by tick, on hardware you control. That's the "building on sand vs building on bedrock" moment. You're not missing a smarter model. You're missing a dataset you can trust.
A backtest you can actually trust
With real ticks under it, a backtest stops being a vibe and becomes a measurement.
Tick-by-tick reconstruction means fills land where they actually would have: a stop fills at the price that traded through it, not at the level you hoped for. The clearest case is the one from the top of the video: when your stop and your target land inside the same bar, a summary just guesses which hit first, and it tends to guess in your favor. Real ticks know the order, and that single question decides whether a "winner" was ever a winner. It means you can find the biases that inflate a curve: optimistic fills, lookahead, an exit that "knew" something it couldn't have known at the time. This is the honest version of the same lesson from the ORB backtest: a green curve can be real and lying at the same time. Honest data is what lets you tell which.
It's a pipeline, not a prompt
Trust doesn't come from a single test. It comes from a chain where every link is verified:
- Data. SCID ticks, read into a clean, fast local dataset.
- Backtest. Reconstruct the strategy on real ticks, honest fills, across years, not one lucky window.
- Signal generation. Turn a validated edge into signals that fire on the live chart. This is a separate step from research, and treating it as separate is the point: research asks "did this work?", forward-testing asks "does it still fire the way I think?"
- Signal verification. The step nobody shows you: prove the live signals actually replicate the backtest: same trades, same entries, bar for bar. If they drift, your backtest was fiction and everything downstream inherits the lie.
- Execution. Verified signals drive automated execution. Data in, trades out, every link in between checked.
Most AI-trading content stops at step three and calls the bot finished. The verification link is the moat: it's the difference between building a system and building one you'd put capital behind.
The power multiplier
Here's where "a thousand times more powerful" stops being a slogan and becomes literal.
Because the data is local and the pipeline is yours, you don't run one backtest. With decent hardware you run thousands (permutations, parameter sweeps, mutations) until you see the full shape of an edge instead of a single number that happened to look good. You learn whether a strategy is robust or whether it was one fragile setting away from falling apart. That kind of depth is not a feature you unlock on TradingView; it's a different category of work, and it's what a real research desk does.
The bottom line
Everyone building with AI is optimizing the wrong end. They're hunting for a better prompt or a newer model on a platform whose backtest was never built to tell the truth. The bottleneck was never the AI writing the strategy. Claude does that fine. The bottleneck is proving the strategy is real: honest fills, no bias, tested across years of ticks and thousands of parameter sets, with live signals verified against the test.
That work is effectively impossible on TradingView and native on Sierra Chart. Claude Code is what makes it accessible to one person instead of a team.
Sierra Chart plus Claude Code is a thousand times more powerful for backtest development than TradingView. I'm not here to sell you a bot. I'm here to be the guide who shows you how to build one right, and this pipeline is where it starts.
This is the map; each stage becomes its own build on the channel. The SCID starter/reader and the Sierra Chart context pack that make Claude great at this ship in the OPTD community. The methodology is free; subscribe to the newsletter to get each stage as it drops. New to the desk? Start here.