


Does the ORB Strategy Actually Work? Backtest It in TradingView with Claude Code
Build the opening range breakout with Claude Code (it writes the Pine Script for you), backtest it in TradingView, and learn to tell when a backtest is lying to you. Naked ORB looks like an edge on the Nasdaq and dies on the S&P, and neither beats just owning the index, so here's what to actually test to turn a trigger into a system.
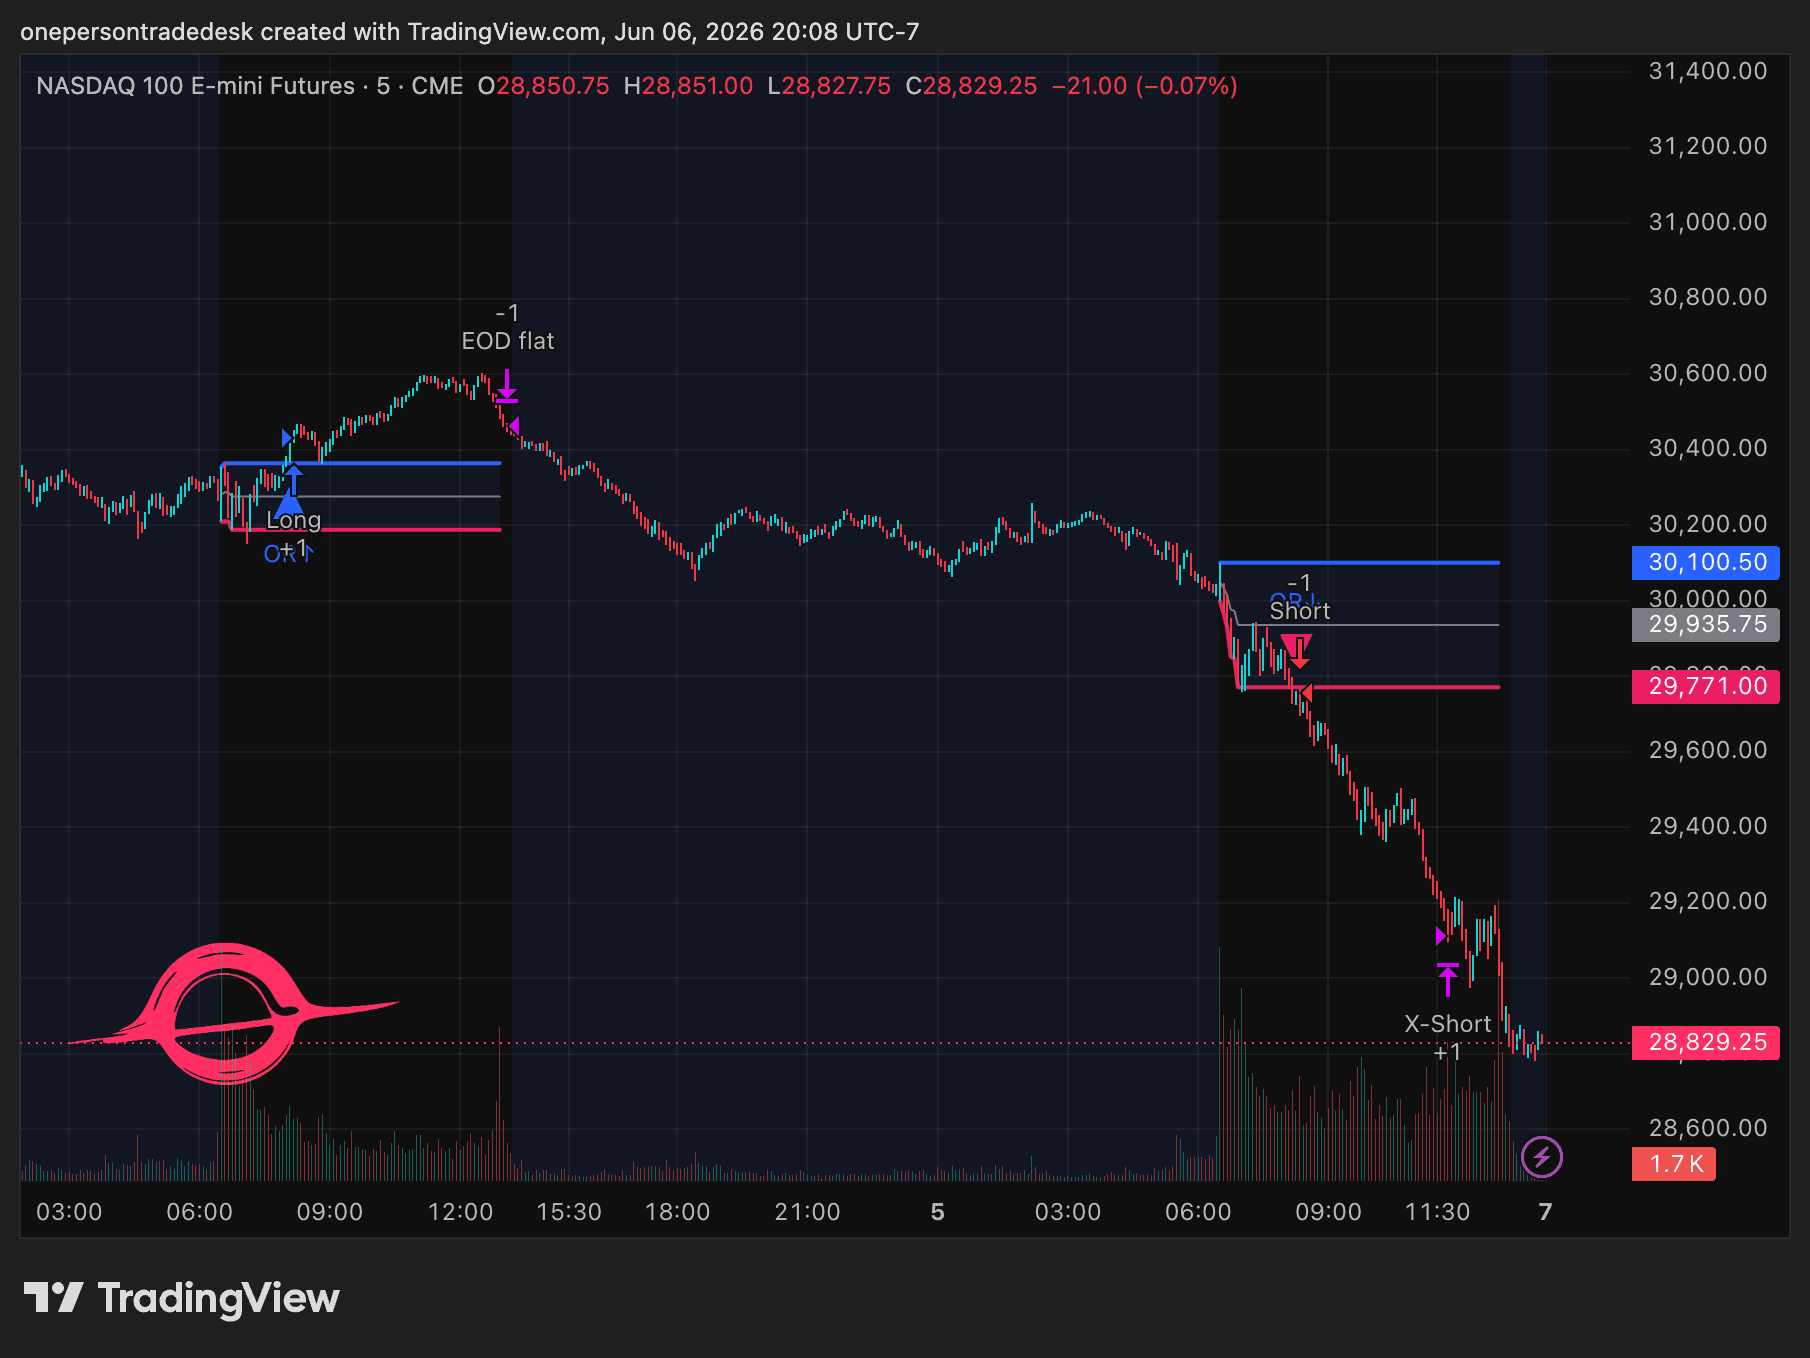
Published May 2026. How to backtest the opening range breakout (ORB) in TradingView using Claude Code, and how to tell whether the result actually means anything.
The opening range breakout is one of the most-searched day-trading strategies on the internet. It's also one of the most-sold. What almost nobody does is the boring part in the middle: actually backtest it, honestly, and look hard at where it breaks.
So that's this post. We'll build the ORB strategy with Claude Code (which is genuinely good at Pine Script, so you don't have to write a line of it yourself), backtest it in TradingView in a few minutes, and then do the part the thumbnails skip: figure out whether the result is real, or whether the backtest is quietly lying to you.
Short answer to the title: the backtest will tell you yes, and it'll be lying. Run naked ORB on the Nasdaq and it looks like a real edge: positive expectancy, six of seven years green. Run it on the S&P and it's dead. But the Nasdaq "edge" dissolves the second you poke it. The distance between "looks like an edge" and "is an edge" is the entire skill of backtesting. That's why "does ORB work?" is the wrong question. "How would I know if it didn't?" is the right one.
What the opening range breakout actually is
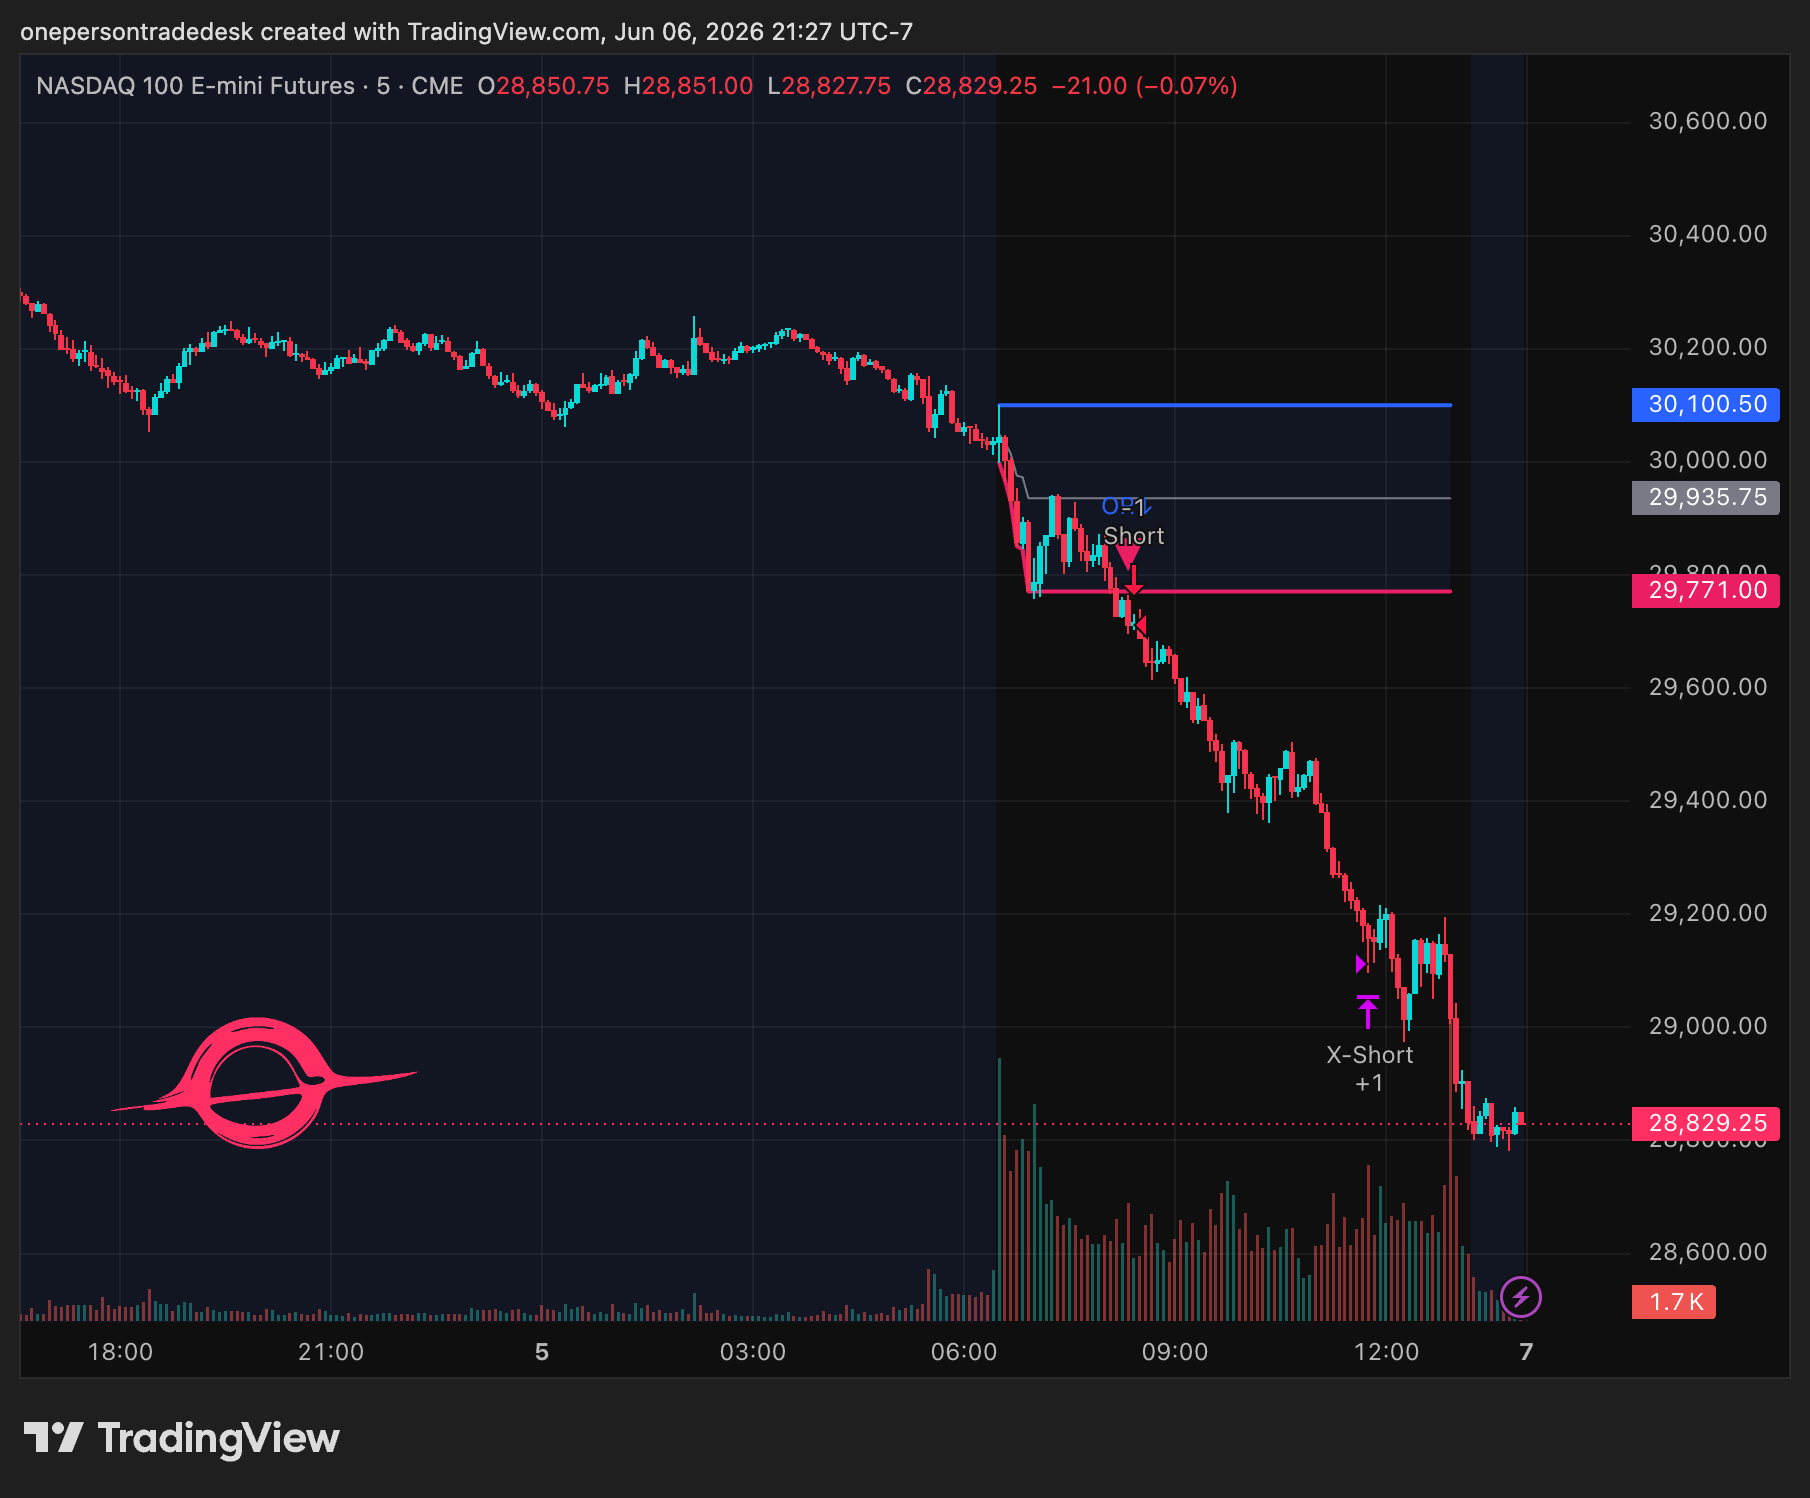
Strip the mystique and ORB is simple. After the market opens, the first chunk of the session (say the first 15 minutes) prints a high and a low. That's the opening range. The strategy:
- Long when price closes above the opening-range high.
- Short when price closes below the opening-range low.
- One trade per day, in the direction of the first breakout.
- Flat by the close.
The thesis: the open is the highest-volatility, highest-participation window of the day. The opening range is where the day's first fight gets settled, and a breakout from it is a bet that the move continues. A lot of traders watch the exact same levels, which makes the breakout partly self-fulfilling.
That's the whole idea. It fits in four bullets. Which is exactly why it's a perfect strategy to learn the workflow on, and a dangerous one to trade on faith.
The anatomy of any trading strategy
Before you backtest anything, it helps to see a strategy as four separate layers. Change any one and you've got a different system to test:
| Layer | In ORB | What changing it does |
|---|---|---|
| Setup | The opening-range high/low (first 15 min) | Defines when you're allowed to act |
| Entry method | A bar closes beyond the range (and how many bars must confirm) | More signals (noisy) vs fewer (cleaner) |
| Exit method | Stop on the opposite side, target at 2R, flat at the close | Shapes the win-rate / payoff trade-off |
| Add-ons | A VWAP filter, day-of-week, a regime gate, pyramiding | Reshape the curve without changing the core idea |
Keep this table in your head for the rest of the post. Every "tweak" you'll be tempted to make is really a change to one of these four layers, and each one is its own thing to validate.
Why TradingView first
TradingView is not where you decide to trade something. It's where you decide whether something is worth more work. That's its superpower: idea to chart with live signals on it in minutes. It's the fastest place on earth to answer one question: is this even worth my time?
If the surface read is garbage, you saved yourself a week. If it's interesting, you've earned the right to go deeper. Treat the TradingView Strategy Tester as a fast filter, not a verdict, and it's one of the best tools you have. Treat it as proof, and it'll cost you an account.
Building the ORB indicator with Claude Code (let it write the Pine Script)
Pine Script is still what runs on the chart. It's TradingView's language, and the indicator and strategy you backtest are both written in it. What's changed is that you don't have to be the one writing it. Claude Code is genuinely good at Pine Script: describe the strategy and it builds it. So the skill that actually matters now isn't syntax. It's being able to describe the rules precisely. That's the hard part: not the code, the precision.
Open Claude Code and describe the indicator in plain English. A prompt like:
Write a TradingView Pine Script v6 indicator for the Opening Range
Breakout (ORB).

- Opening range = the high and low of the first 15 minutes after the
  session open (regular session). Make the window a configurable input.
- Lock the range once the 15-minute window closes; do not let it update
  after that.
- Mark a long signal when a bar CLOSES above the opening-range high.
- Mark a short signal when a bar CLOSES below the opening-range low.
- One signal per day, first breakout only. No signals after 11:30 AM ET.
- Use closed-bar logic only — no forming-bar reads, no lookahead.
  State next to the entry condition that it evaluates on bar close.
Notice what that prompt does: it tells Claude exactly what to plot, not "find me a strategy." Precise input, precise output. That's the entire workflow.
Here's the part people get backwards about AI and code. Yes, the model is non-deterministic: ask it the same question twice and you may get two different answers. That's genuinely useful when you're brainstorming or thinking through confluences. But what it's producing here isn't an opinion, it's an indicator. And code is deterministic. Same data in, same lines and signals out, every run. The non-determinism helps you think. The determinism is what you ship and what you can test. You can't run a backtest against something that changes every time.
Before you paste anything into TradingView, read it. Two things to check on any ORB indicator:
- How is the opening range calculated, and does it lock at the right time? If the range keeps updating after the window closes, every signal downstream is wrong.
- Is the signal evaluated on bar close or on the forming bar? Forming-bar logic is how you get an indicator that looks perfect in hindsight and repaints the second you reload the chart.
Turning it into a strategy and running the backtest
An indicator just draws. To backtest, TradingView needs a strategy: a script that places simulated orders. Ask Claude to convert it:
Now convert that indicator into a Pine Script v6 STRATEGY.

- Long: bar closes above the opening-range high (first breakout only).
- Short: bar closes below the opening-range low (first breakout only).
- Stop: opposite side of the opening range. Target: 2R. One trade/day,
  flat by session end. No entries after 11:30 AM ET.
- Add commission and slippage inputs (default commission 0.02%,
  slippage 1 tick) so the test isn't unrealistically clean.
- Keep the same closed-bar logic. No lookahead.
The two lines that matter most there: commission and slippage. TradingView defaults both to zero, which makes every backtest look better than reality. Turning them on is the difference between a number you can think about and a number that's lying to you.
Paste it in, add it to the chart, and open the Strategy Tester panel. You'll get net profit, total trades, percent profitable, profit factor, max drawdown, and the equity curve. That's a backtest. It is not yet a result you can trust. The next section is why.
Your backtest is probably lying to you
This is the part most content leaves out, because it's the part that doesn't sell. Here's exactly where a TradingView backtest is thin:
- Intrabar fills. On a standard backtest, TradingView assumes how price moved inside each bar to fill your orders. That assumption is usually optimistic. Without the bar-magnifier / tick data, it's not using real ticks.
- Data history. Depending on your plan, you only get so many bars. A few hundred trades on two years of one symbol is not a robust sample.
- Repainting and lookahead. Pine makes it easy to accidentally read future data, especially with higher-timeframe requests. A lot of "amazing" published strategies are just repainting.
- No robustness testing. One backtest on one set of inputs tells you almost nothing about whether the edge survives outside this exact window. No walk-forward. No Monte Carlo. No parameter-sensitivity sweep.
- One symbol, one timeframe. Real validation runs across instruments and regimes. This is one chart.
The bias audit (the full catalog of ways a backtest inflates an edge that isn't there) is the part professional desks live in and retail skips. It's the methodology spine of everything else on this site.
So, does ORB actually work?
Here's the honest answer, and it's the whole point of the post.
Run the naked opening range breakout on the Nasdaq (NQ) futures over seven years (2019–2025), with realistic costs, and the Strategy Tester hands you a winner: profit factor 1.08, positive expectancy of +0.06R per trade, six of seven years green, +$118k on a single contract. Now run the exact same rules on the S&P 500 (ES) (same setup, same entry, same exits) and it's dead: profit factor 0.96, slightly negative, red in five of seven years.
So, trade NQ, skip ES? No. This is exactly where the backtest is lying to you, and where most content stops. Take the NQ result apart:
- It's almost all one direction. Split the trades long vs short and 84% of the profit is longs (+$99k); the shorts barely clear breakeven (+0.02R). A real breakout edge works both ways. A one-sided "edge" is a tell.
- It's mostly just drift. Replace the whole strategy with a dumb control: buy at 10:00, sell at the close, every single day, no breakout logic at all. On NQ that nets +$54k. Nasdaq simply drifted up intraday for seven years, and the ORB was along for the ride. Strip the beta and roughly half the "edge" vanishes.
- There's no fat tail. A structural breakout produces runners: trades that go 3R, 4R, 5R. Naked NQ goes beyond 3R about 0.3% of the time. The thing that's supposed to make a low-win-rate breakout pay isn't there.
Put those together and the NQ "edge" is a marketing screenshot: a slightly-positive profit factor propped up by a bull market, with a –$38k drawdown in 2020 waiting under it. It would not survive a single one of the validation steps below. Naked ORB (the version on the thumbnails, with a fixed range, a fixed 2R, and no context) has no edge that beats just owning the index. NQ only hides that better than ES does. (Note the scope: this is a verdict on the hyped version, not on every ORB variant ever built. Change the exits, the levels, the instrument universe, and you're testing a different system, which is the whole point of the next section.)
And before you ask: no, this isn't one cherry-picked setting. Sweep both the common opening-range lengths (15 and 30 minutes) and the number of closes you require beyond the range to confirm (one through ten), and the picture doesn't budge: across every one of those settings, ES never clears breakeven and NQ stays mildly green. The split is real and stable. It's the interpretation ("NQ has an edge") that's wrong.
Same strategy, same code, two misleading answers. That's the entire argument for backtesting properly in one example, and it's why anybody selling you "the ORB strategy" off a green equity curve is selling you a vibe. (ORB is public and well-documented, which is exactly why it's safe to show real numbers here. The systems that fund a real desk start from a clean breakout like this and bury it under context the surface test can't see, and that part stays private. The methodology is what's worth giving away.)
Add one confluence and re-test
One more thing that shows why the workflow is worth learning even at the surface level: adding a condition to test is one prompt.
Add a 50-day EMA trend filter to the strategy:
- Compute a 50-day EMA on the daily close (use the prior day's value
  so there's no lookahead).
- Only take longs when the breakout is above the 50-day EMA.
- Only take shorts when it's below. Keep everything else the same.
A trend filter like this is the right kind of thing to test: generic, well-understood, no hidden anchoring quirks. Re-run and put the numbers next to the old. On our data it does three honest things worth seeing:
- It actually changes something. The filter roughly halves the trade count: fewer, cleaner signals. (Contrast a session-VWAP filter, which on an ORB breakout rejects almost nothing: by the time price breaks the range it's already on the right side of VWAP. A confluence that changes nothing isn't a confluence.)
- With-trend beats against-trend on both instruments, a small sign the breakout at least aligns with the larger trend rather than fighting it.
- It polishes the number but rescues neither. The filter lifts NQ's profit factor and trims ES's losers, and it's tempting to read that as progress. But the same dissolve still applies: filtered NQ is still that one-sided drift in a prettier wrapper, and filtered ES is still red. A confluence sharpens a real edge; on a non-edge it just hands you a cleaner-looking non-edge. That's the trap: a filter that improves a fake edge feels exactly like a filter that improves a real one. Only the deep validation tells them apart.
The point isn't the EMA. It's that you went from idea to tested result in about two minutes. That speed is the real product. But speed only matters if you point it at the right questions. So what's actually worth testing?
ORB is a trigger, not a strategy
Here's the reframe that turns this whole post from a teardown into something you can use: ORB isn't a strategy. It's a trigger. The breakout tells you when to look: it says nothing about whether the trade is any good, or how to hold it once you're in. Naked ORB fails because it stops at the trigger and leaves the other four-fifths of the system on default: the entry confirmation, the exits, and the context.
That's also the good news. The breakout isn't worthless: it's incomplete. The real work is what you bolt onto it: where price sits relative to the prior days, whether the breakout level is structurally real (market-profile value areas, single prints), whether other markets confirm (ES vs NQ, yields, the dollar), and volatility-aware exits instead of a lazy fixed 2R. Each one is a single Claude Code prompt to test, but each one also has to clear the same brutal gate, or you're just overfitting at speed: does it actually reject trades, does it beat the benchmark (the drift control and buy-and-hold, not just zero), and does it survive out-of-sample?
That's a whole post on its own, and it's the next one in the series: How to Make the ORB Strategy Actually Work, the constructive half of this teardown. The takeaway here is simpler: ORB hands you a trigger for free; the work worth paying for is everything you build around it.
What "validate properly" means
The survivors of the fast filter go into the deep pipeline, and that's a different kind of work:
- Tick-level execution: real fills, modeled slippage, not bar-replay guesses.
- Out-of-sample + walk-forward: re-fit on rolling windows, evaluate on the next. If walk-forward dies, the system was overfit.
- Permutation and Monte Carlo: is the edge distinguishable from luck? What's the distribution of drawdowns, not just the one you got?
- Parameter sensitivity: vary each input ±20%. If the result is a knife-edge, so is your account.
That deep validation doesn't happen in TradingView. It happens in a real engine (for us, Sierra Chart plus Python), and it's the subject of the next video and the next post in this series.
Get the indicator + watch the build
The exact ORB indicator from this post is free: it's in the optd-starter repo on the resources page. Clone it, drop it on a chart, and run this same backtest on your own symbol and dates.
- Watch the full build: Does ORB Actually Work? on YouTube, the live Claude Code session, start to finish.
- Get the methodology weekly: the newsletter, backtesting, bias detection, and system design, plus the free tools as they ship.
What you build today is real and useful. Just don't confuse a fast read with a finished answer.
New here? Start with what the One Person Trade Desk actually is.