


5 Claude Code Trading Strategies, Tested on 1.7 Billion Ticks: Every Published Setting
The five most-taught trading strategies on YouTube, built by Claude Code from published settings and run four ways on 1.7 billion ticks of ES futures data. Every parameter, every cost assumption, and the full scoreboard — including the survivor that turned out to be a long position with extra steps.

Published August 2026: the five most-taught trading strategies on YouTube, built by Claude Code from published settings, and run four ways on 1.7 billion ticks of ES futures data. This is the written companion to the video above — every parameter, every cost assumption, and the full scoreboard, so you can check the claim instead of taking it.
On camera I said the same thing twice: "all published settings, nothing for sale" and "I didn't tune anything, I just built what the video said to build."
That's a claim, and a claim you can't check is worth nothing. So this post is the check. Every parameter below is read out of the code that produced the results — not from memory, and not from the script.
If you want the short version: Claude Code built all five strategies correctly, and all five failed. Not one of them failed because of bad code. That's the whole point.
What was held constant
One experiment, one variable. Every strategy, every pass, every run:
| Parameter | Value |
|---|---|
| Instrument | ES (E-mini S&P 500) futures, front month, 1 contract |
| Tick / point | 0.25 pts per tick · $50.00 per point · $12.50 per tick |
| Window | 2020-01-01 → 2026-07-18 — COVID, the 2022 bear market, the 2023–26 rally |
| Bars | 5-minute, built from ticks, regular trading hours only |
| Session | 06:30–13:00 PT, flat by 12:55 PT. No overnight holds, ever |
| Total trades | 7,334 |
Contract rolls are not back-adjusted. Every strategy here is intraday and flat by the close, so no trade spans a roll. Signals that need the prior session — the gap fade, the MACD warmup — skip the first session after a roll rather than synthesize a price that never traded.
Two rules enforced across all five
1 · No lookahead. A signal is evaluated on a closed bar and entered at the next bar's open. Never at the signal bar's close — you don't know a bar's close until the bar is over. The one place this rule is deliberately broken is Pass 0, where it's re-introduced on purpose. That's the cheat being measured.
2 · No tuning. Every parameter is the published one. Where a published rule has no stop and no target — RSI(2), MACD — none was invented. Those exit on a market order when the indicator flips. That's why the fill model barely touches them, which turns out to be a finding rather than a flaw.
One trade per session per strategy
The first qualifying signal of each session is taken, and that's it.
Position management has to be identical across passes, and any "wait until you're flat" rule would depend on when the trade exited — which is the exact thing the two fill models disagree about. Session-capping is deterministic, pass-independent, and adds no tuning knob.
This does truncate RSI(2) and MACD, which would otherwise signal more often intraday. ORB and the gap fade are one-per-day as published anyway. Stating it here rather than burying it.
The five strategies, exactly as tested
1 · VWAP reversion
| Rule | Setting |
|---|---|
| Indicator | Session-anchored VWAP with ±2.0σ bands, reset at each session open |
| Long | Close ≤ lower band |
| Short | Close ≥ upper band |
| Target | VWAP |
| Stop | 1σ further out — lower − 1σ for longs, upper + 1σ for shorts |
| Exit | Level-based, or flat at the close |
| Trades | 1,412 |
2 · RSI(2) mean reversion
| Rule | Setting |
|---|---|
| Indicator | Wilder's RSI, period 2 — RMA smoothing, not a simple average. That's the published form |
| Long | RSI(2) < 10 |
| Short | RSI(2) > 90 |
| Exit | RSI crosses 50, or the close. Market order |
| Stop / target | None — as published. Nothing invented |
| Source | Connors & Alvarez |
| Trades | 1,688 |
3 · Opening range breakout
| Rule | Setting |
|---|---|
| Range | First 15 minutes of the session |
| Entry | Close beyond a rail |
| Stop | Opposite rail — 1R, where R is the opening range width |
| Target | 2R |
| Exit | Level-based, or flat at the close |
| Trades | 1,678 |
4 · MACD momentum
| Rule | Setting |
|---|---|
| Indicator | MACD(12, 26, 9) — the every-tutorial default |
| Entry | MACD line crosses its signal line; trade the direction of the cross |
| Exit | Opposite cross, or the close. Market order |
| Stop / target | None — as published |
| Source | Appel |
| Trades | 1,688 |
5 · Gap fade
| Rule | Setting |
|---|---|
| Trigger | Session opens ≥ 0.30% away from the prior session close |
| Direction | Fade it — gap up goes short, gap down goes long |
| Target | The prior session close, i.e. the gap fill |
| Stop | 1× the gap size beyond entry, anchored to the price actually paid, not the opening print |
| Exit | Level-based, or flat at the close |
| Trades | 868 — a 0.3% gap doesn't happen every day, which is why this sample is roughly half the others |
A prediction made before the results
The code splits the five up front, so the results either confirm it or embarrass it:
- Level exits — VWAP reversion, ORB, gap fade. The fill model should bite hard.
- Signal exits — RSI(2), MACD. Market orders, so the fill model should barely matter.
The results confirmed it. Worth knowing that before you read them.
The four passes
Same entries, same stops, same targets, every run. The only thing that changes is the price you actually get filled at.
| Pass | Entry | Commission | Fills | Slippage |
|---|---|---|---|---|
| P0 — the lane default | Signal bar's close — the price you can't know | $0.00 | Touch = fill | none |
| P1 — honest entry | Next bar's open | $4.00 RT | Bar-level touch, guessed same-bar sequence | none |
| P2a — honest fills | Next bar's open | $4.00 RT | Tick sequence, limits must trade through | none |
| P2b — + slippage | Next bar's open | $4.00 RT | Tick sequence, trade-through | 0.53 ticks/side |
That split is the whole point. "It died of slippage" is a boring result every trader already discounts. "It died of fills that never happened" is the actual claim, and P1 → P2a is the only place it can be measured.
Where the cost numbers come from:
- Commission $4.00 round turn. A conservative ceiling — AMP all-in verifies at $3.24–$3.90. Rounded against myself.
- Slippage 0.53 ticks/side. Measured off the tape, not assumed. ES is one tick wide about 99.5% of the time, so crossing costs roughly 0.50 ticks. The harness charges 0.53 — slightly worse than reality.
Dropped entries are counted, not hidden. A guard skips any entry whose stop was already breached or target already reached at the entry price. A silent skip is a sampling bias, so the count gets printed.
The scoreboard
Net P&L, 1 contract, over the full window.
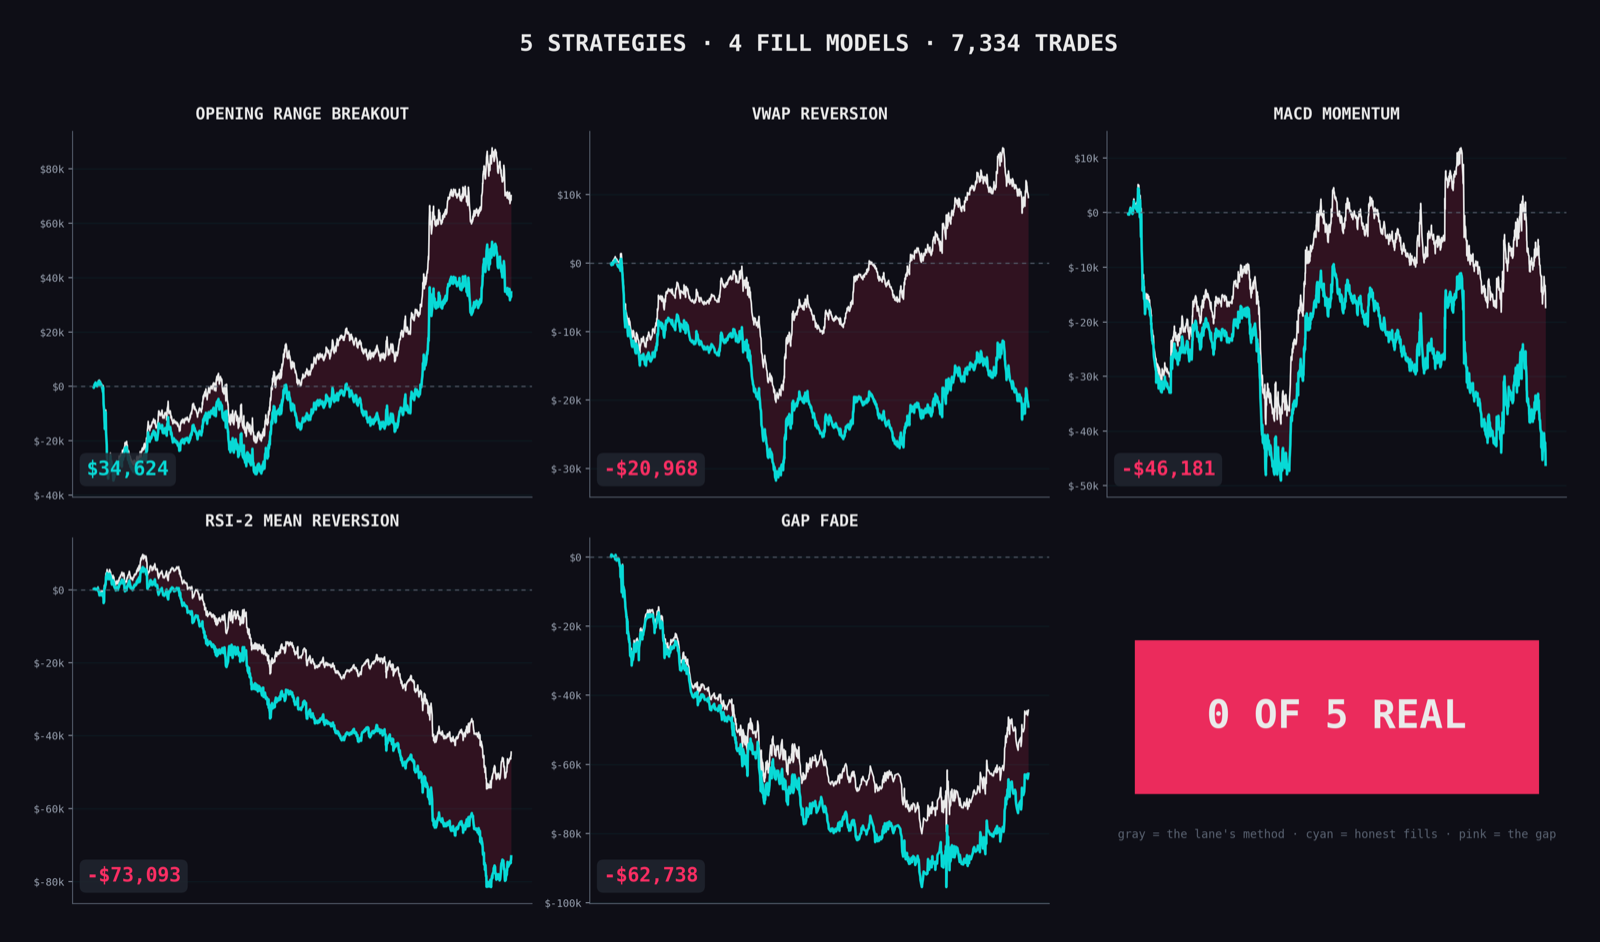
| Strategy | Trades | P0 cheats | P1 honest entry | P2a honest fills | P2b + slippage |
|---|---|---|---|---|---|
| MACD | 1,688 | −$17,362 | −$24,064 | −$24,027 | −$46,181 |
| RSI(2) | 1,688 | −$44,525 | −$50,727 | −$50,727 | −$73,093 |
| Gap fade | 868 | −$44,350 | −$47,710 | −$55,160 | −$62,738 |
| VWAP reversion | 1,412 | +$9,550 | +$4,927 | −$5,048 | −$20,968 |
| Opening range | 1,678 | +$70,212 | +$63,126 | +$50,876 | +$34,624 |
Three of them lost money in Pass 0 — the pass with commission set to zero, entries at a price you couldn't have known, and a fill on every touch. They lost with every advantage I could hand them. That's the first lie: fit. If a strategy loses while cheating, you're done. There's nothing else to check, and you can run that test tonight.
Now read the P1 → P2a column for the two signal-exit strategies. MACD moves $37. RSI(2) moves $0. Their exits are market orders, so the honest fill model has nothing to bite. VWAP reversion moves −$9,975 over the same step and flips from green to red. That's the prediction landing, and that's lie two: fill.
The tell is how concentrated the damage is. 55 trades out of 7,334 — under 1% of the sample — carry 100% of it. You will never catch that by looking at an equity curve.
And ORB survived all four passes at +$34,624, which is where most videos roll the credits. Then it failed the drift test: a position that entered and exited at exactly the same moments while ignoring the signal completely earned $51.62 per trade, against ORB's $51.12 on the long side. Fifty cents apart. It wasn't a strategy, it was a long position with extra steps. That's lie three: fluke.
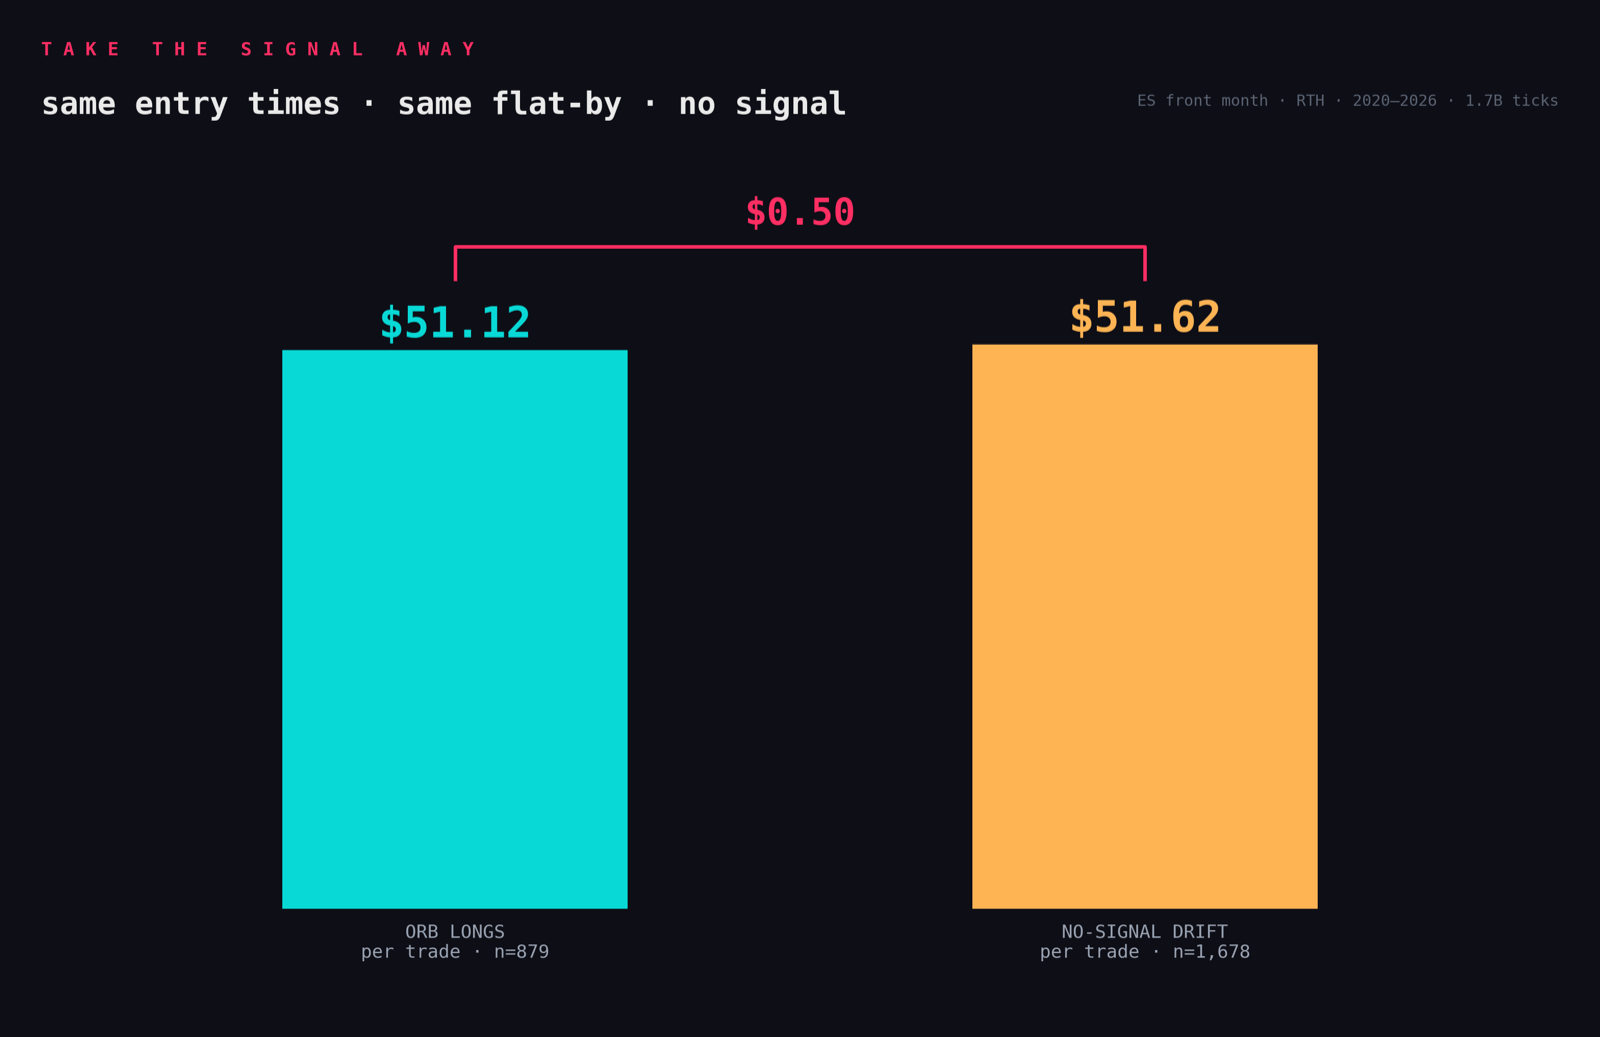
Buy-and-hold over the same window: +$212,512. ORB made about a sixth of that and needed 1,600 trades to do it. TradingView prints the buy-and-hold return directly under your equity curve. It was sitting there the whole time.
What was not done
"I didn't tune anything" only means something with a list attached:
- No parameter search. No grid, no walk-forward, no in-sample/out-of-sample split — because nothing was fitted. There was no parameter to fit.
- No strategy selection. All five were chosen before any of them ran, on the basis of being the most-taught. None were dropped for underperforming.
- No filters added. No regime filter, no volatility filter, no time-of-day filter beyond regular hours.
- No stop or target invented where the published rule has none.
- No survivorship in the reporting. The three that died in Pass 0 are reported at every pass, not dropped at the point they failed.
Honest limits of this post
I'd rather state these than have you find them.
- These are ES-only results. Nothing here says how the same settings behave on another instrument.
- Five is a small sample, and they were chosen for being popular, not for being representative.
- This is not a claim these five are bad strategies, or that a tuned version would fail. It's a controlled test of what happens to a published configuration when the fill model stops flattering it.
- The five scanners live in a private research repo, not in the public starter. The settings are fully disclosed above and the method is free and runnable, but the scanner source itself isn't published. ORB is the exception — it's in the public repo, so that one is checkable end to end. You should know exactly what you're getting.
The part that should actually worry you
I ran these tests deliberately. I had the right data, the right tools, and the background to do it without errors. I still introduced five biases of my own.
442 phantom stop gaps would have made a great thumbnail — until I looked at the stop values the backtest was using. They were sitting at tenths of a point instead of on real quarter-point tick boundaries. Those prices don't exist; you couldn't place a stop there. Once I rounded them to real tick values, all 442 went to zero. That dramatic number was my own bug, and I knew what I was doing.
My code also silently dropped 118 trades and printed results that looked completely normal. Great numbers. Great curve. They only vanished when the validation counters ran.
None of that is catchable by looking at an equity curve after the fact. Which is exactly why building with AI can lull you into a false sense of security: the code is correct, it runs, the output looks plausible, and it's still wrong. The build is free now. Knowing whether it works is the expensive part.
Run the gauntlet yourself
Three lies, three tests:
- Fit — let the backtest use every advantage. Zero commission, fill on every touch, enter at the signal close. If it still loses money, stop.
- Fill — ask your backtest one question: when my stop and my target land inside the same bar, how do you decide which one hits first? If it can't answer, it's guessing, and it guesses in your favor. Then count how many of your winners needed a fill at a price the market only touched. Under 1% is not a reason to relax — that was the number here.
- Fluke — take the signal away. Same times in, same times out, no signal, just be in the market. If you can't beat that, you don't have a strategy. You have market drift. This one takes about ten minutes to run and it's the most likely to ruin your night.
All three ship as runnable code on synthetic data, so you can watch each bias get created and then caught before you point them at anything of your own.
The three-test gauntlet is free — grab it here and it lands in your inbox. The validated tick-data kernel, the SCID reader, and the full research harness are the paid layer; the methodology never is. New to the desk? Start here, or read the pipeline this sits inside: Sierra Chart + Claude Code.