


How to Reverse Engineer Any TradingView Indicator (and Port It to Sierra Chart)
Port a TradingView indicator to Sierra Chart with Claude Code in six steps, then prove it matches bar by bar. The free prompts, the build errors and the license rule.
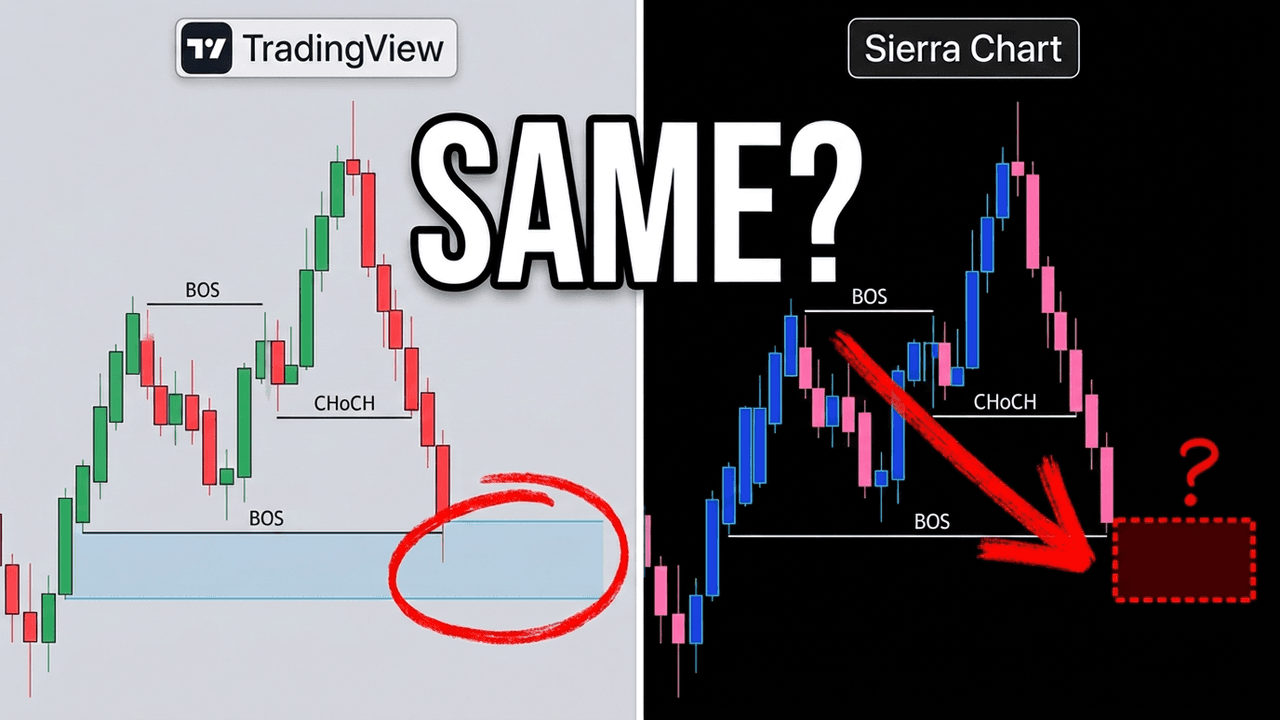
The written companion to the video above: the six steps I use to port a TradingView indicator to Sierra Chart with Claude Code, the check that tells you whether the port actually matches, and the free prompts that run the whole thing.
Short answer: copy the indicator's Pine Script source, have Claude Code port it to a Sierra Chart ACSIL study, build it, then export both charts and compare them bar by bar. The last step is the one that matters. In the video, the port looked right on the chart and was still missing a zone. Only the export compare showed it.
Why port an indicator at all?
Data. On my TradingView plan I get about 20,000 bars. That sounds like a lot until you're on a 1-minute chart, where it's a couple of weeks. In Sierra Chart I have data going back to 2011, so I can backtest an indicator over years instead of weeks.
The six steps
1. Find the indicator
Pick the indicator you actually want to port, and check what kind of script it is:
- Open source. The easy case. You have the whole code, so there's nothing to reverse engineer. Copy it.
- Free but closed. You can't see the code, but you can still get close. See No source code? below.
- Invite-only or paid. I leave these alone. They're closed, they're paid, and they're not my indicator.
2. Save the TradingView export
Export the chart data from TradingView with the indicator on it. Two settings matter:
- Scroll back first. The export only includes the bars you've loaded, so load as much history as you want to compare.
- Time format: UNIX timestamp. Claude Code reads it without guessing at timezones.
Save the Pine Script source next to it. You now have the two things the port needs: the code and what the code produced.
3. Port it with Claude Code
This is where I rely on AI the most. Point Claude Code at Sierra Chart's own ACS_Source folder so it uses the real ACSIL names instead of inventing them, and give it the Pine Script and the export.
The prompt asks for an inventory before any code: every input with its default, every series and the order it's calculated in, every piece of state that carries between bars, and anything that repaints or looks ahead. Then it ports the code as written, not what it thinks the code meant. Depending on how complex the indicator is, this takes anywhere from five to 10 minutes. Smart Money Concepts is a big one: the port in the video took 12 minutes and 33 seconds.
4 and 5. Copy it to ACS_Source and build it
Copy the .cpp into Sierra Chart's ACS_Source folder, then build it: Analysis → Build Custom Studies DLL. Add it with Analysis → Studies → Add Custom Study, pick the DLL, pick the study. If you've never built a study, this walkthrough covers the build from scratch.
I do all of this in what I call the lab: sim mode, no live connections, no other live indicators. A port that compiles can still have bugs, and I don't want code I haven't validated anywhere near an account.
6. Match it
This is the step most ports skip. Export the Sierra Chart side too: Edit → Write Bar and Study Data To File (include the hidden subgraphs). Now you have two files, and Claude Code can compare them:
- Bar data first. Open, high, low and close on every bar. If the prices don't match, it's the data and not the port, so fix that first.
- Then every indicator value, bar by bar. It tells you what percentage agree and exactly which bars don't. If the first bars are off, it's usually warm-up: your data starts at a different point on each platform.
When the values agree on 99% of the bars or more, I trust it enough to use. Below that, I go back to the first bar that fails, fix the code, rebuild and compare again.
The demo: Smart Money Concepts
For the video I took the most popular indicator on TradingView, Smart Money Concepts by LuxAlgo. It adds market structure to the chart: breaks of structure, changes of character, order blocks, equal highs and lows, fair value gaps. SMC isn't my trading style, but it has a lot of the concepts I follow, and it's open source.
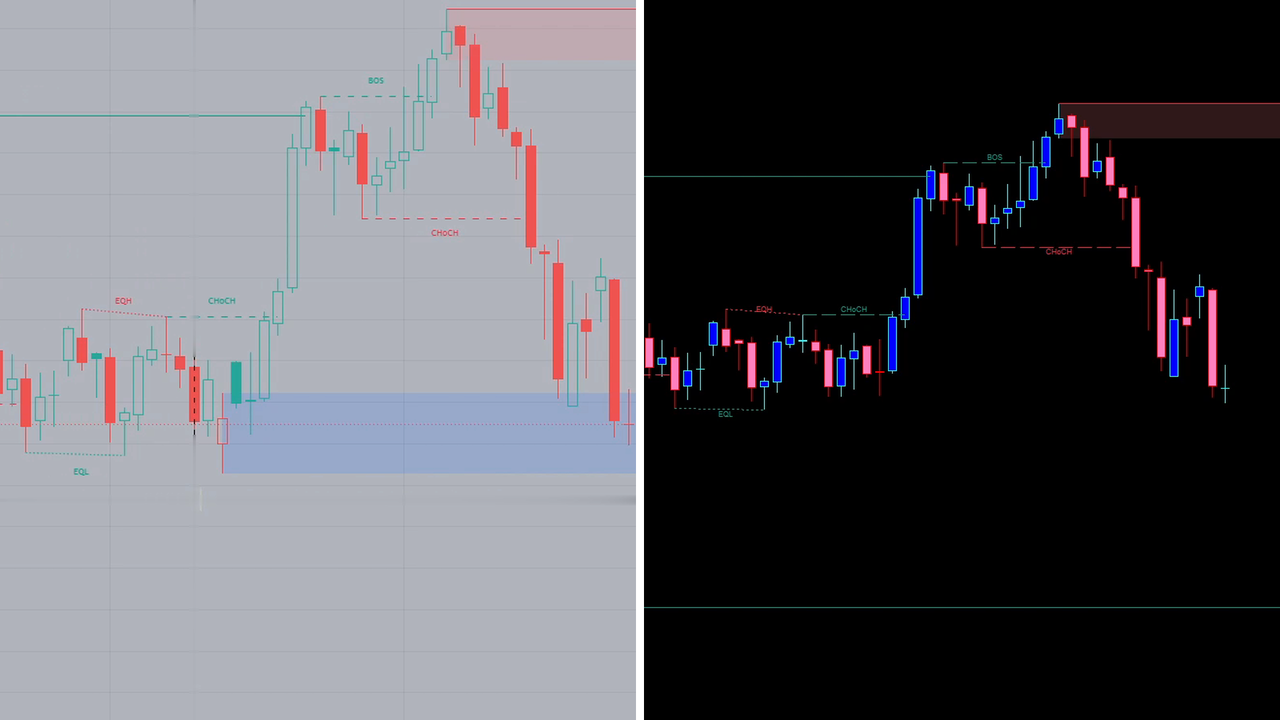
After the port, I added the study in Sierra Chart and compared it to TradingView by eye. It looked correct. The sell zone on October 6th lined up exactly, and so did the levels around it.
Then I compared it properly. A blue zone from September 14th was on TradingView and never appeared in Sierra Chart.
So the port was maybe 80 to 90% of the way there. That's typical: Claude Code gets you most of the way, then you iterate. The fix could be as small as one setting. But nothing on the chart told me it was missing. Looking right isn't the same as being right, and the export compare is how you find out.
Build errors you'll hit
The port prompt's code rules exist because of these. If Claude Code follows them, most won't happen, but when one does, paste the error straight back to it.
no custom study function names found. The build made a DLL with nothing in it. Usually the file isn't inACS_Source,SCDLLName()is missing, or the study function isn't declaredSCSFExport.source file is missing. Sierra Chart is holding a stale path from an earlier build. Copy the file again and reopen the build dialog so it rescans the folder.- Errors around
max. Windows definesmaxas a macro. Writing(std::max)(a, b)sidesteps it. - You change a default and nothing happens. No error, nothing. Sierra Chart saves a study's defaults the first time you add it to a chart. Remove the study and add it again. This is the one that costs the most time.
No source code?
If the indicator is free but closed, you can still get close. Export the TradingView data across several timeframes, take screenshots of every setting the indicator has, and give all of it to Claude Code. The more data you give it, the better. Do it on more than one instrument if you can, like NQ and ES.
It's a brute-force method. Ask Claude Code to form a hypothesis from the inputs and fit it on some of the files, then test it on a file it hasn't seen. It won't be as accurate as a port of real source code, but you can get very close by going back and forth.
Read the license first
Open source doesn't mean anything goes. Most open-source TradingView scripts are licensed non-commercial and share-alike, and those terms carry over to your port. Smart Money Concepts is © LuxAlgo, licensed CC BY-NC-SA 4.0. My port is an example for personal use and I'm not distributing it. Never sell or share a port of someone else's script.
FAQ
Can you convert a TradingView indicator to Sierra Chart?
Yes. Sierra Chart studies are C++ (ACSIL), and Claude Code can port Pine Script to it if you give it the source and Sierra Chart's own ACS_Source examples. Then export both charts and compare them bar by bar before you trust it.
How long does it take to port a Pine Script indicator? Usually five to 10 minutes for the code. Smart Money Concepts, a large indicator, took Claude Code about 12 and a half minutes. Then budget a few rounds of build, export and compare.
How do I know my port matches TradingView? Export both sides: TradingView's chart data and Sierra Chart's Write Bar and Study Data To File. Check that the prices match first, then compare every indicator value bar by bar. I want 99% agreement or better.
Can I reverse engineer a closed-source TradingView indicator? You can get close with exports across several timeframes and screenshots of every setting, but it won't be exact. Invite-only and paid scripts I leave alone.
Get the prompts. The port prompt, the compare prompt, the six steps and the build errors are free in one file: pine_to_sierra_port.md on GitHub. They run in plain Claude Code. No signals, no live P&L.
What's your process, and what platform do you run your indicators on? Tell me in the video comments.